When I posted “Where next for gilt yields?” on 4 December 2014 I didn’t expect to be updating it in just over 2 months. But here goes. I have included the text from my previous blog in bold italics.
Where next for gilt yields was down…. by a lot.
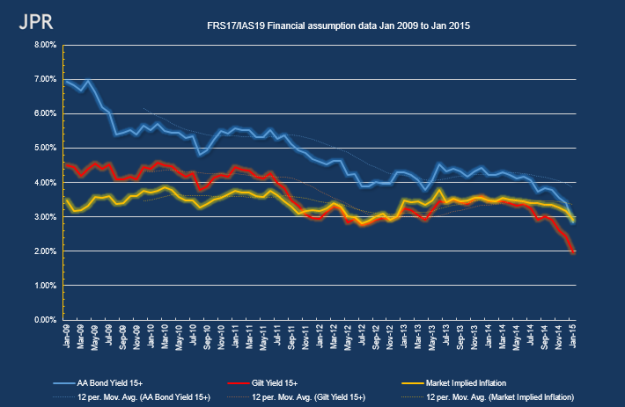
This is shown in the updated graph below.
The blue line is the yield on over 15 year AA rated corporate bonds, The red line is the yield on over 15 year gilts. The yellow line is market implied inflation: calculated as gilt yield minus index-linked gilt yield.
In my previous blog I wrote…
There are 3 things that I want to point out from this graph:
Firstly, and probably most importantly, gilt yields show little sign of going up. We haven’t even had much in the way of false dawns. Any spike in yields has quickly leveled off before resuming a downward trend. If trustees and sponsors are waiting for yields to rise, there is no knowing how long they will have to wait.
Update: the yield on over 15 year gilts is now below 2%. As at 30 January 2015 it was 1.97% (Source: IBoxx)
Secondly, the yield gap between gilts and AA bonds has been below 1% for the past 17 months. For those trustees who only use high quality bonds in their matching portfolio this means that a 50/50 gilt/bond portfolio is only yielding 3.09% – this is the lowest yield since I started collating the data in January 2009 (when the composite yield was 5.73%).
Update: the yield gap is still below 1%. On 30 January 2015 it was 0.87%. The composite yield on a 50/50 portfolio was 2.41%
Thirdly, the yellow line has been above the red line since they crossed 3 years ago – this means that index linked gilts have had a negative yield for the past 3 years. As at 28 November 2014 this stood at an astonishing -0.66%. This means that a buy and hold strategy on index-linked gilts guarantees a significant real loss against RPI.
Update: As at 30 January 2015 the yield on index linked gilts was -0.95%
So, where next for gilt yields?
Ask yourself these questions:
1. Can gilt yields get any lower?
2. Can the yield gap get squeezed any further?
3. How long will people accept a negative real return on their investment?
I have revised the chart from December’s blog. It now looks like this.
Over the past 2 months we have seen gilt yields fall from 2.44% at the end of November 2014 to 1.97% at the end of January 2015. It is unlikely that anyone could have predicted such a precipitous fall.
As i said in December
“The future is notoriously difficult to predict and always has the capacity to surprise.”
JPR
